- DegenDen
- Posts
- BTC Volatility at Record Lows, Leverage at Record Highs — Something Has to Break
BTC Volatility at Record Lows, Leverage at Record Highs — Something Has to Break
Bitcoin’s monthly Bollinger BandWidth just hit record lows — a setup that historically precedes parabolic moves — while futures leverage, liquidations, and institutional flows hit new extremes.
Degen Den
December 03, 2025
In partnership with
Intro
Hey Degens,
BTC right now is like a loaded spring on a wobbly table.
On one side, volatility is at record lows on the monthly chart. Bollinger BandWidth has never been this compressed, and every time it’s dipped this low in the past, BTC followed up with a parabolic leg up.
On the other side, the derivatives market is fully juiced:
Daily liquidations this cycle have almost tripled vs the last one.
Open interest in futures hit record highs.
We already saw a “preview” in October when $640M/hour in longs got vaporized in one of the sharpest deleveragings in BTC history.
Oh, and while that’s happening, BTC quietly turned into a serious settlement rail:
~$6.9 trillion in value moved over the network in 90 days — rivaling or beating Visa/Mastercard-type rails.
Around 6.7M BTC now sits in ETFs, corporate treasuries and other institutional vaults.
So yeah, the setup is basically:
Historic volatility + record leverage + institutional anchor.
The question isn’t if something big happens. It’s who gets wiped when it does.
Let’s unpack.
Your Thoughts on DegenDen |
TL;DR
Monthly Bollinger BandWidth for BTC is at all-time lows — historically, every dip below ~100 on that metric has led to a sharp, parabolic leg up; the last “green signal” in Nov 2023 preceded BTC roughly doubling in 4 months.
Some analysts see this as the final explosive wave before a later macro bear — comparable to GOOGL’s blowoff before ’08.
Short term, traders do not fully trust the bounce yet; they want BTC to hold above the current zone and yearly open (~$93.5K) to confirm structure.
This cycle’s futures liquidations have nearly tripled: average daily wipes went from ~$28M longs / $15M shorts last cycle to ~$68M longs / $45M shorts now.
Open interest touched a record ~$68B, perps are >90% of futures volume, and “Early Black Friday” on Oct 10 saw $640M/hour in longs nuked and OI down 22% in 12 hours.
Spot volume has doubled vs last cycle and ETFs helped shift price discovery back toward cash markets, even as leverage concentrated in perps.
Over the past 90 days, Bitcoin settled $6.9T, rivaling the world’s biggest payment rails, while ~6.7M BTC now sits in ETFs, company treasuries and other institutional buckets.
Brought to you by:
How High-Net-Worth Families Invest Beyond the Balance Sheet

Every year, Long Angle surveys its private member community — entrepreneurs, executives, and investors with portfolios from $5M to $100M — to understand how they allocate their time, money, and trust.
The 2025 High-Net-Worth Professional Services Report reveals what today’s wealthy families value most, what disappoints them, and where satisfaction truly comes from.
From wealth management to wellness, from private schools to personal trainers — this study uncovers how the top 1% make choices that reflect their real priorities. You’ll see which services bring the greatest satisfaction, which feel merely transactional, and how spending patterns reveal what matters most to affluent households.
Benchmark your household’s service spending against peers with $5–25M portfolios.
Learn why emotional well-being often outranks financial optimization.
See which services families are most likely to change — and which they’ll never give up.
Understand generational differences shaping how the wealthy live, work, and parent.
See how your spending, satisfaction, and priorities compare to your peers. Download the report here.
Main Event: Part 1
BTC at $92K
Bollinger Bands Are Whispering “Parabolic”

BTC/USD one-month chart with Bollinger BandWidth data. Source: TradingView
Let’s start with the big signal everyone’s screenshotting.
What the hell is BandWidth and why do we care?
Bollinger Bands are a volatility tool: upper and lower bands around price based on standard deviations.
BandWidth measures the distance between those bands as a percentage — basically, “how squeezed” the market is.
On the monthly BTC chart:
BandWidth is now at its lowest level ever recorded.
Historically, it very rarely dips below ~100 on its internal scale.
Every time it has, BTC followed with a violent, parabolic move up shortly after.
Macro strategist Gert van Lagen calls these “green” signals:
The last one printed in early November 2023.
After that, BTC roughly 2x’d in four months.
We just printed another green signal — but this time, after a nasty drawdown instead of clean trend. That’s interesting.
“Identical to GOOGL before its last blowoff”
Van Lagen goes further and compares the setup to:
Google’s final blowoff wave before the 2008 financial crisis.
The pattern:
BandWidth keeps making lower highs as volatility compresses.
Then you get a final break → explosive move up →
Followed by a regime change into bearish, high-timeframe volatility.
Applied to BTC, his map looks like:
Parabolic leg up from this compressed zone to new highs.
Then a true bear market, after this blowoff is done.
Is that guaranteed? No. Is this the kind of thing you ignore? Also no.
Why traders are still skeptical right now
On lower timeframes, traders are trying to reconcile:
The structural, monthly-level signal screaming “parabolic incoming,” with
The messy reality of the current range.
Recent price action:
BTC printed a higher high and higher low on some intraday timeframes.
It briefly pushed to the highest levels in a couple of weeks, sniffing around $94K on rumors of a more pro-crypto Fed chair.
Structurally, that puts the short-term trend back to “technically bullish”… if it can hold above the current zone instead of faking out and rolling over.
Traders like Rekt Capital are also watching the yearly candle games:
BTC opened the year around $93.5K.
If it can finish the year just 2% higher than now, it closes the yearly candle as a clean green, above the key “four-year cycle” level.
So the tension is:
HTF indicators (monthly BandWidth, four-year cycle levels) say the stage is set for something big.
LTF structure says: “Nice start, but show me you can sustain above this zone and not rug.”
Main Event: Part 2
Leverage Is on Fire, and Liquidations Tripled
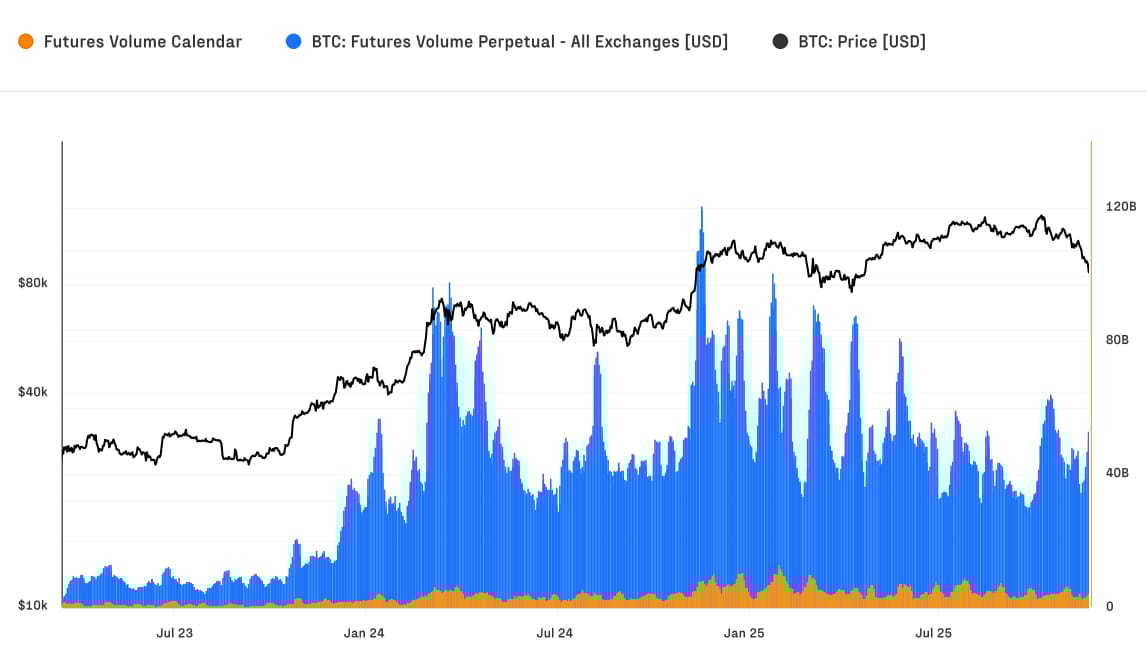
Bitcoin Futures market. Source: Glassnode
Now for the gasoline on that compressed spring: derivatives.
Glassnode + Fasanara’s new report basically says:
“Welcome to the most leveraged Bitcoin market we’ve ever seen.”
Daily liquidations: almost 3x last cycle
Compare the last cycle (2021–2022) to this one (from Nov 2022 bottom to now):
Old cycle avg daily liquidations:
~$28M longs,
~$15M shorts.
Current cycle avg daily liquidations:
~$68M longs,
~$45M shorts.
That’s nearly 3x the liquidations on both sides, every day on average.
The clearest example was Oct 10, which they dubbed an “Early Black Friday”:
BTC dumped from ~$121K to ~$102K.
Around $640M per hour in longs got liquidated.
Open interest collapsed 22% in under 12 hours, from ~$49.5B to ~$38.8B.
Glassnode calls it one of the sharpest deleveraging events in BTC history.
That’s the environment we’re in now:
More leverage, faster wipes, deeper impact.
Open interest + perps dominance
Futures activity has exploded:
Open interest climbed to a record ~$67.9B.
Daily futures volume hit as high as ~$68.9B in mid-October.
Perpetuals = >90% of all futures activity.
So most of the “market” you see intraday is:
Heavily margined positions in instruments that never expire.
Traders using high leverage to chase small moves.
A constant tug-of-war between overexposed longs and trigger-happy shorts.
Layer that onto record-low volatility, and the message is:
When this range breaks, it’s not just going to be a nice trend.
It’s going to be a liquidation event.
Structural Shift: The Market Grew Up While the Kids Were Degening
Here’s the twist: this is not the same market as 2017 or 2021.
Spot actually matters again
Glassnode points out:
BTC spot volume has doubled versus the prior cycle.
Now running roughly $8B–$22B/day.
During the Oct 10 crash, hourly spot volume spiked to $7.3B, more than triple recent peaks — people bought the dip rather than fleeing.
Since the launch of U.S. spot BTC ETFs:
Price discovery has tilted back toward the cash market.
Leverage is still built in futures, but ETF flows + spot demand now carry real weight.
That’s why we see:
BTC’s market share climb from ~38.7% in late 2022 to ~58.3% now.
Monthly inflows into BTC ranging from $40B to $190B.
Realized cap hitting $1.1T, with $732B added since the 2022 lows — more than all previous cycles combined.
This isn’t just spec anymore.
It’s structured capital building long-term exposure.
BTC as a settlement rail… vs Visa
In the last 90 days:
The Bitcoin network processed around $6.9T in transfers —
rivaling and even surpassing Visa/Mastercard throughput over the same window in some comparisons.
At the same time:
Roughly 6.7M BTC is now parked in:
ETFs,
Corporate balance sheets,
Centralized and decentralized treasuries.
U.S. spot ETFs alone absorbed about 1.5M BTC since early 2024.
Centralized exchange balances have been drifting down, meaning less “hot” supply for immediate sale.
So:
You have more leverage than ever on the perps side.
You have more spot + ETF anchoring than ever on the cash side.
You have more capital committed to BTC as an asset than in all prior cycles combined.
Which means when that compressed BandWidth finally lets go…
It’s not just going to be a retail-led candle.
It’s going to be a structural repricing event for an asset sitting in ETFs, treasuries and macro portfolios.
Here’s where we are:
Volatility: Record-low compression on the monthly Bollinger BandWidth — historically followed by face-melting upside.
Leverage: Record-high open interest, tripled daily liquidations, and perps driving intraday chaos.
Structure: Spot, ETFs and treasuries anchoring BTC as real macro collateral and a serious settlement rail.
Something big is coming out of this mix.
You don’t need to know whether the first move is +40% or –20%.
You just need to:
Size so you survive either,
Position so you benefit from one,
And stay sane enough to still be here when the monthly signal finishes playing out.
The spring is loaded.
Don’t stand in front of it with 50x.
See you in the next one.
The Degenden Team
Reply